Log audit
Logs record activity in the cluster. Audit logs are necessary not only to ensure that services are running and configured as expected, but also to ensure the security of the system. Systematic audits require consistent and thorough examination of security settings to help identify potential threats. Kubernetes is able to capture audit logs of cluster operations and monitor basic CPU and memory usage information; however, it does not provide in-depth monitoring or alerting services.
key point
- Establish a Pod baseline at creation time to be able to identify anomalous activity.
- Logging at the host level, application level and cloud (if applicable).
- Integrate existing network security tools for comprehensive scanning, monitoring, alerting and analysis.
- Set up local log storage to prevent loss in case of communication failure.
log
System administrators running applications in Kubernetes should set up an effective logging, monitoring, and alerting system for their environment. Merely logging Kubernetes events is not enough to get the full picture of the actions taking place on the system. Logging should also be done at the host level, application level, and on the cloud (if applicable). Furthermore, these logs can be correlated with any external certification and system logs to provide a complete view of actions taken across the environment for use by security auditors and incident responders.
In a Kubernetes environment, administrators should monitor/log the following:
- API request history
- Performance
- Deployment status
- LF
- Operating system calls
- Changes in protocols and permissions
- Network traffic
When a Pod is created or updated, administrators should capture detailed logs of network traffic, response times, requests, resource consumption, and any other relevant metrics to establish a baseline. As detailed in the previous section, anonymous accounts should be disabled, but logging policies should still record actions taken by anonymous accounts to identify anomalous activity.
RBAC policy configurations should be audited regularly and whenever there are changes to the organization's system administrators. Doing so ensures that access control adjustments comply with the RBAC policy hardening guidance outlined in the Role-Based Access Control section.
Audits should include comparing current logs to baseline measurements of normal activity to identify significant changes in any log metrics and events. System administrators should investigate significant changes—for example, changes in application usage or the installation of malicious programs such as Cipher to determine the root cause. Internal and external traffic logs should be audited to ensure that all expected security restrictions on the connection have been configured correctly and are functioning as expected. Administrators can also use these audits as the system evolves to determine when external access is no longer needed and can be restricted.
Logs can be directed to external logging services to ensure they are available to security professionals outside the cluster to identify anomalies as close to real-time as possible and protect logs from deletion if a compromise occurs. If using this method, logs should be encrypted in transit with TLS 1.2 or 1.3 to ensure that cyber actors cannot access the logs in transit and gain valuable information about the environment. Another precaution to take when leveraging an external log server is to configure a log forwarder within Kubernetes with append-only access to the external storage. This helps protect externally stored logs from being deleted or overwritten by in-cluster logs.
Kubernetes native audit log configuration
The audit function of Kubernetes is disabled by default, so if no audit policy is written, there will be no records.
kube-apiserver resides on the Kubernetes control plane and acts as a front-end, handling internal and external requests to the cluster. Every request, whether generated by a user, application, or control plane, generates an audit event at every stage of its execution. When an audit event is registered, kube-apiserver checks the audit policy file and applicable rules. If such a rule exists, the server logs the event at the level defined by the first matching rule. The built-in auditing function of Kubernetes is not enabled by default, so if no audit policy is written, there will be no records.
The cluster administrator must write an audit policy YAML file to establish rules and specify the required audit level to log each type of audit event. This audit policy file is then passed to kube-apiserver with the appropriate flags. For a rule to be considered valid, one of four audit levels must be specified: none, Meatadataa, Request, or RequestResponse. Appendix L: Audit Policy shows the contents of an audit policy file that records all events at the RequestResponse level. Appendix M Example of flags for submitting audit policy files to kube-apiserver shows the location of the kube-apiserver configuration file and provides An example of the flags that an audit policy file can be passed to kube-apiserver. Appendix M also provides guidance on how to mount volumes and configure host paths if necessary.
kube-apiserver includes configurable logging and webhook backends for audit logs. The logging backend writes specified audit events to a log file, and the webhook backend can be configured to send the file to an external HTTP API. The --audit-log-path and --audit-log-maxage flags set in the example in Appendix M are two examples of ways you can configure a logging backend that writes audit events to a file. The log-path flag is the minimum configuration to enable logging and is the only configuration required for the logging backend. The default format for these log files is JSON, although this can be changed if necessary. Additional configuration options for the logging backend can be found in the Kubernetes documentation.
In order to push audit logs to your organization's SIEM platform, the webhook backend can be configured manually via a YAML file submitted to kube-apiserver. The webhook configuration file and how to pass it to kube-apiserver can be viewed in the examples at Appendix N: webhook configuration. An exhaustive list of configuration options on how to set up the webhook backend in kube-apiserver can be found in the Kubernetes documentation.
Logging of worker nodes and containers
There are many ways to configure logging functionality in a Kubernetes architecture. In the built-in method of log management, the kubelet on each node is responsible for managing logs. It stores and rotates log files locally based on its policies for individual file length, storage time, and storage capacity. These logs are controlled by the kubelet and can be accessed from the command line. The following command prints the logs of the containers in a Pod.
kubectl logs [-f] [-p] POD [-c CONTAINER]
如果要对日志进行流式处理,可以使用 -f 标志;如果存在并需要来自容器先前实例的日志,可以使用 -p 标志;如果 Pod 中有多个容器,可以使用 -c 标志来指定一个容器。如果发生错误导致容器、Pod 或节点死亡,Kubernetes 中的本地日志解决方案并没有提供一种方法来保存存储在失败对象中的日志。NSA 和 CISA 建议配置一个远程日志解决方案,以便在一个节点失败时保存日志。
远程记录的选项包括:
| 远程日志选项 | 使用的理由 | 配置实施 |
|---|---|---|
| 在每个节点上运行一个日志代理,将日志推送到后端 | 赋予节点暴露日志或将日志推送到后端的能力,在发生故障的情况下将其保存在节点之外。 | 配置一个 Pod 中的独立容器作为日志代理运行,让它访问节点的应用日志文件,并配置它将日志转发到组织的 SIEM。 |
| 在每个 Pod 中使用一个 sidecar 容器,将日志推送到一个输出流中 | 用于将日志推送到独立的输出流。当应用程序容器写入不同格式的多个日志文件时,这可能是一个有用的选项。 | 为每种日志类型配置 sidecar 容器,并用于将这些日志文件重定向到它们各自的输出流,在那里它们可以被 kubelet 处理。然后,节点级的日志代理可以将这些日志转发给 SIEM 或其他后端。 |
| 在每个 Pod 中使用一个日志代理 sidecar,将日志推送到后端 | 当需要比节点级日志代理所能提供的更多灵活性时。 | 为每个 Pod 配置,将日志直接推送到后端。这是连接第三方日志代理和后端的常用方法。 |
| 从应用程序中直接向后端推送日志 | 捕获应用程序的日志。Kubernetes 没有内置的机制直接来暴露或推送日志到后端。 | 各组织将需要在其应用程序中建立这一功能,或附加一个有信誉的第三方工具来实现这一功能。 |
Sidecar containers run in a Pod along with other containers and can be configured to stream logs to a log file or a logging backend. A sidecar container can also be configured to act as a traffic proxy for another standard functionality container, which is packaged and deployed.
To ensure continuity of these logging agents across worker nodes, they are typically run as a DaemonSet. Configuring a DaemonSet for this approach ensures that there is a copy of the logging agent on each node and that any changes made to the logging agent are consistent across the cluster.
Seccomp: Audit mode
In addition to the node and container logs mentioned above, it can also be very beneficial to log system calls. One way to audit container system calls in Kubernetes is to use the Secure Compute Mode (seccomp) tool. This tool is disabled by default, but can be used to limit the system call capabilities of the container, thereby reducing the kernel's attack surface. Seccomp can also log ongoing calls through the use of audit profiles.
A custom seccomp configuration file is used to define which system calls are allowed, and the default action for unspecified calls. To enable a custom seccomp profile in a Pod, Kubernetes administrators can write their seccomp profile JSON file to the /var/lib/kubelet/seccomp/ directory and add seccompProfile to the Pod's securityContext. The custom seccompProfile should also include two fields. Type: Localhost and localhostProfile: myseccomppolicy.json. Logging all system calls can help administrators understand which system calls are required for standard operation, allowing them to further restrict seccomp profiles without losing system functionality.
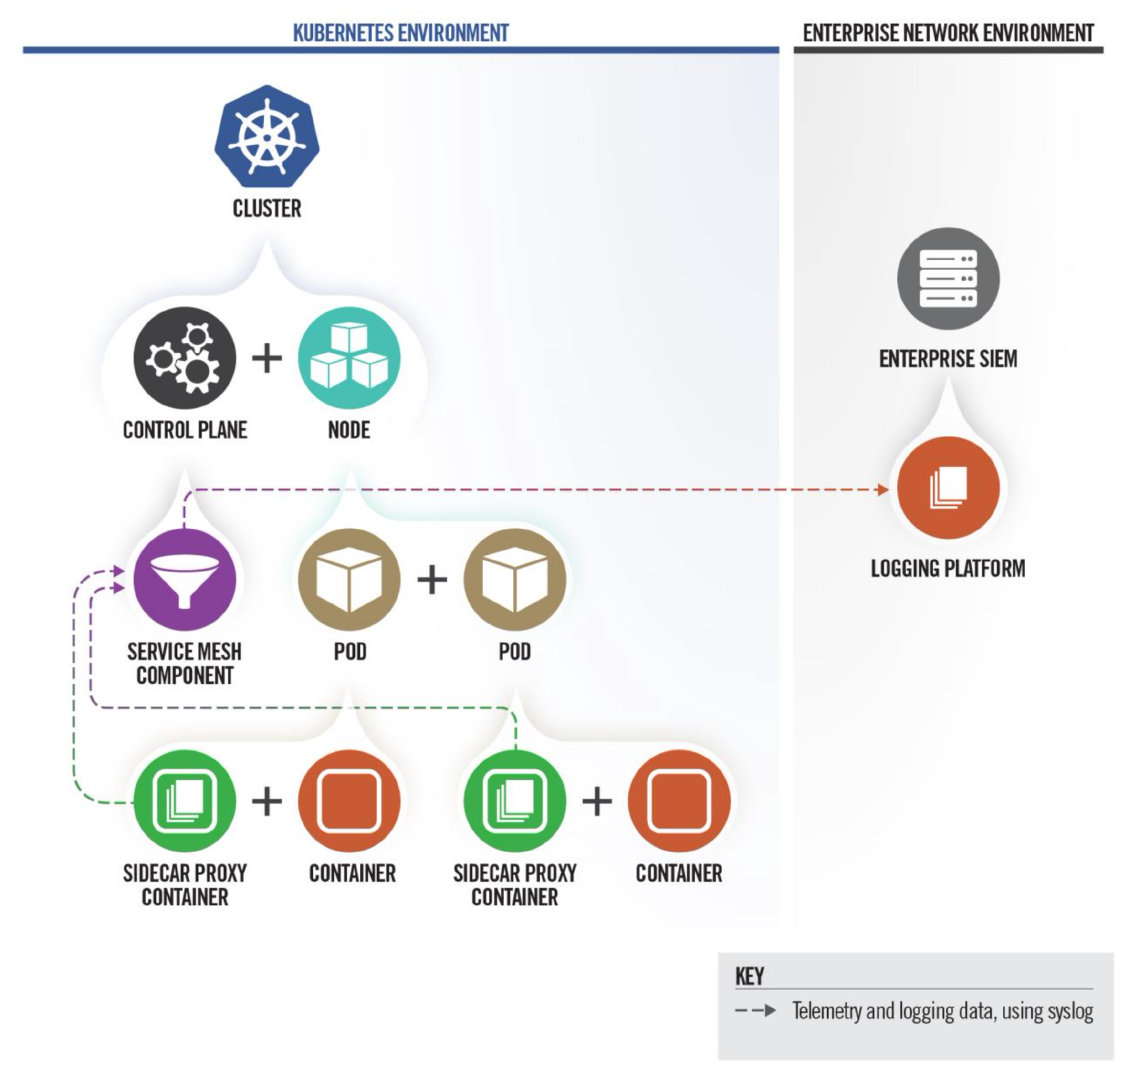
SYSLOG
Kubernetes writes kubelet logs and container runtime logs to journald by default, if that service is available. If organizations want to use the syslog tool for systems that are not used by default, or to collect logs from an entire cluster and forward them to a syslog server or other log storage and aggregation platform, they can manually configure this feature. The Syslog protocol defines a log information formatting standard. Syslog messages include a header consisting of a timestamp, hostname, application name, and process ID (PID), and a message written in clear text. Syslog services, such as syslog-ng® and rsyslog, can collect and summarize logs from the entire system in a unified format. Many Linux operating systems default to rsyslog or journald - an event logging daemon that optimizes log storage and outputs logs in syslog format via journalctl. On nodes running some Linux distributions, the syslog tool logs events at the operating system level by default. Containers running these Linux distributions also use syslog to collect logs by default. Logs collected by the syslog tool are stored in the local file system of each applicable node or container, unless a log aggregation platform is configured to collect them.
SIEM Platform
Security information and event management (SIEM) software collects logs from across an organization's network. SIEM software brings together firewall logs, application logs, and more; parses them out to provide a centralized platform from which analysts can monitor system security. SIEM tools vary in functionality. Generally, these platforms provide log collection, threat detection, and alerting capabilities. Some include machine learning capabilities that can better predict system behavior and help reduce false alarms. Organizations using these platforms in their environments can integrate them with Kubernetes to better monitor and secure their clusters. Open source platforms for managing logs in Kubernetes environments exist as alternatives to SIEM platforms.
Containerized environments have many interdependencies between nodes, pods, containers, and services. In these environments, pods and containers are constantly being shut down and restarted on different nodes. This creates additional challenges for traditional SIEMs, which typically use IP addresses to correlate logs. Even next-generation SIEM platforms are not necessarily suitable for complex Kubernetes environments. However, as Kubernetes has become the most widely used container orchestration platform, many organizations developing SIEM tools have developed product variations specifically for Kubernetes environments, providing comprehensive monitoring solutions for these containerized environments. Administrators should understand the capabilities of their platform and ensure their logs adequately capture the environment to support future incident response.
Alert
Kubernetes does not natively support alerting; however, some monitoring tools with alerting capabilities are compatible with Kubernetes. If a Kubernetes administrator chooses to configure an alerting tool to work in a Kubernetes environment, there are several indicators that the administrator should monitor and configure alerts for.
Cases that may trigger an alert include, but are not limited to:
- Disk space is low on any machine in the environment.
- The available storage space on the recording volume is decreasing.
- The external log service is offline.
- A Pod or application running with root privileges.
- A request made by an account for a resource to which they do not have permission.
- An anonymous account that is using or gaining privileges.
- The IP address of the pod or worker node is listed as the source ID of the pod creation request.
- Abnormal system calls or failed API calls.
- The user/admin is behaving unusually (i.e. at an unusual time or from an unusual location), and
- Significant deviation from the standard operating indicator baseline.
Alerting when storage is low can help avoid performance issues and log loss due to limited resources and help identify malicious cryptojacking attempts. Privileged Pod execution cases can be investigated to determine whether an administrator made a mistake, a real use case requires escalating privileges, or a malicious actor deployed a privileged Pod. Suspicious Pod creation source IP addresses may indicate that a malicious network actor has breached the container and attempted to create a malicious Pod.
Integrating Kubernetes with an enterprise's existing SIEM platforms, especially those with machine learning/big data capabilities, can help identify violations in audit logs and reduce false alarms. If such a tool is configured to work with Kubernetes, it should be configured to trigger alerts for these conditions and any other conditions applicable to the use case.
Systems capable of taking automated action when a suspected intrusion occurs can potentially be configured to take steps to mitigate damage as administrators respond to alerts. In cases where a Pod IP is listed as the source ID of a Pod creation request, one mitigation that can be implemented is to automatically evict the Pod to keep the application available but temporarily halt any damage to the cluster. Doing so will allow a clean pod version to be rescheduled onto a node. Investigators can then examine the logs to determine whether a breach occurred and, if so, investigate how the malicious actor carried out the potential threat so that a patch can be deployed.
Service Grid
A service mesh is a platform that simplifies microservice communication within an application by allowing these communication logic to be encoded into the service mesh, rather than within each microservice. Encoding this communication logic into individual microservices is difficult to scale, difficult to debug when failures occur, and difficult to ensure security. Using a service mesh simplifies a developer's job. A service mesh can:
- Redirect traffic when a service is interrupted.
- Collect performance metrics to optimize communications.
- Allows management of service-to-service communication encryption.
- Collect logs of inter-service communications.
- Collect logs from each service.
- Help developers diagnose problems and failures in microservices or communication mechanisms.
Service meshes can also help migrate services to hybrid or multi-cloud environments. While service meshes are not required, they are an option that is highly suitable for Kubernetes environments. Managed Kubernetes services typically include their own service mesh. However, several other platforms are available and can be highly customized if desired. Some include a certificate authority that generates and rotates certificates, allowing secure TLS authentication between services. Administrators should consider using a service mesh to harden the security of their Kubernetes clusters.
Fault Tolerance
A fault tolerance strategy should be developed to ensure the availability of the log service. These strategies can vary based on the specific Kubernetes use case. One strategy that can be implemented is to allow new logs to overwrite the oldest log files if it is absolutely necessary to exceed storage capacity.
If logs are sent to an external service, a mechanism should be established to store the logs locally in the event of a communication interruption or external service failure. Once communication with the external service is restored, a strategy should be developed to push locally stored logs to the external server.
tool
Kubernetes does not include extensive auditing capabilities. However, the system is built to be extensible, allowing users the freedom to develop their own custom solutions or select existing add-ons that suit their needs. One of the most common solutions is to add an additional audit backend service that can consume the information logged by Kubernetes and perform additional functionality for users, such as extended search parameters, data mapping capabilities, and alerting capabilities. Enterprises already using SIEM platforms can integrate Kubernetes with these existing capabilities.
Open source monitoring tools, such as Cloud Native Computing Foundation's Prometheus®, Grafana Labs' Grafana®, and Elasticsearch's Elastic Stack (ELK)® - can be used to monitor events, run threat analysis, manage alerts, and collect resource isolation parameters and historical usage status and network statistics of running containers. When auditing access control and permission configurations, scanning tools can be useful by assisting in identifying risky permission configurations in RBAC. The NSA and CISA encourage organizations using intrusion detection systems (IDS) in existing environments to consider integrating the service into their Kubernetes environments as well. This integration will enable enterprises to monitor and potentially kill containers that show signs of unusual behavior, allowing containers to be restarted from an initially clean image. Many cloud service providers also offer container monitoring services for those who want a more managed and scalable solution.