Remove Friction and Reduce Frustration with These Tricks
Content
Tricks and tools to solve all your debugging needs like a PRO
📌 Introduction
Let's talk about making your experience with Kubernetes (K8s) easy! I have got some simple tips and tricks to share that will help you solve some of your problems easily.
Examining Running Pods
First, look at the logs of the affected container:
kubectl logs ${POD_NAME} ${CONTAINER_NAME}If your container has previously crashed, you can access the previous container's crash log with:
kubectl logs --previous ${POD_NAME} ${CONTAINER_NAME}If the container image includes debugging utilities, as is the case with images built from Linux and Windows OS base images, you can run commands inside a specific container with kubectl exec:
kubectl exec ${POD_NAME} -c ${CONTAINER_NAME} -- ${CMD} ${ARG1} ${ARG2} ... ${ARGN}As an example, to look at the logs from a running Cassandra pod, you might run
kubectl exec cassandra -- cat /var/log/cassandra/system.logYou can run a shell that's connected to your terminal using the -i and -t arguments to kubectl exec, for example:
kubectl exec -it cassandra -- shDebug with an Ephemeral Debug
Ephemeral containers are useful for interactive troubleshooting when kubectl exec is insufficient because a container has crashed or a container image doesn't include debugging utilities, such as with distroless images.
Debugging Using Ephemeral Containers
You can use the kubectl debug command to add ephemeral containers to a running Pod. First, create a pod for the example:
kubectl run ephemeral-demo --image=registry.k8s.io/pause:3.1 --restart=NeverThe examples in this section use the pause container image because it does not contain debugging utilities, but this method works with all container images. If you attempt to use kubectl exec to create a shell, you will see an error because there is no shell in this container image.
kubectl exec -it ephemeral-demo -- sh
OCI runtime exec failed: exec failed: container_linux.go:346: starting container process caused "exec: \"sh\": executable file not found in $PATH": unknown
You can instead add a debugging container using kubectl debug. If you specify the -i/--interactive argument, kubectl will automatically attach to the console of the Ephemeral Container.
kubectl debug -it ephemeral-demo --image=busybox:1.28 --target=ephemeral-demo
Defaulting debug container name to debugger-8xzrl.
If you don't see a command prompt, try pressing enter.
/ #
This command adds a new busybox container and attaches to it. The --target parameter targets the process namespace of another container. It's necessary here because kubectl run does not enable process namespace sharing in the pod it creates. The --target parameter must be supported by the Container Runtime. When not supported, the Ephemeral Container may not be started, or it may be started with an isolated process namespace so that ps does not reveal processes in other containers.
Using kubectl describe pod
For this example, we'll use a Deployment to create two pods, similar to the earlier example.
apiVersion: apps/v1
kind: Deployment
metadata:
    name: nginx-deployment
spec:
    selector:
        matchLabels:
            app: nginx
    replicas: 2
    template:
        metadata:
            labels:
                app: nginx
        spec:
            containers:
            - name: nginx
                image: nginx
                resources:
                    limits:
                        memory: "128Mi"
                        cpu: "500m"
                ports:
                - containerPort: 80
Create the deployment by running the following command:
kubectl apply -f nginx.yaml
deployment.apps/nginx-deployment created
Check the pod status with the following command:
kubectl get podsNAME READY STATUS RESTARTS AGE
nginx-deployment-67d4bdd6f5-cx2nz 1/1 Running 0 13s
nginx-deployment-67d4bdd6f5-w6kd7 1/1 Running 0 13sWe can retrieve a lot more information about each of these pods using kubectl describe pod. For example:
kubectl describe pod nginx-deployment-67d4bdd6f5-w6kd7Name: nginx-deployment-67d4bdd6f5-w6kd7
Namespace: default
Priority: 0
Node: kube-worker-1/192.168.0.113
Start Time: Thu, 17 Feb 2022 16:51:01 -0500
Labels: app=nginx
pod-template-hash=67d4bdd6f5
Annotations: <none>
Status: Running
IP: 10.88.0.3
IPs:
IP: 10.88.0.3
IP: 2001:db8::1
Controlled By: ReplicaSet/nginx-deployment-67d4bdd6f5
Containers:
nginx:
Container ID: containerd://5403af59a2b46ee5a23fb0ae4b1e077f7ca5c5fb7af16e1ab21c00e0e616462a
Image: nginx
Image ID: docker.io/library/nginx@sha256:2834dc507516af02784808c5f48b7cbe38b8ed5d0f4837f16e78d00deb7e7767
Port: 80/TCP
Host Port: 0/TCP
State: Running
Started: Thu, 17 Feb 2022 16:51:05 -0500
Ready: True
Restart Count: 0
Limits:
cpu: 500m
memory: 128Mi
Requests:
cpu: 500m
memory: 128Mi
Environment: <none>
Mounts:
/var/run/secrets/kubernetes.io/serviceaccount from kube-api-access-bgsgp (ro)
Conditions:
Type Status
Initialized True
Ready True
ContainersReady True
....🛠️ Get Images with Almost Any Tool You Want
Whenever I troubleshoot anything container-related, I look for a good container image that contains all the right tools to troubleshoot and/or solve the problem. To save both you and me the hassle of finding or building such image(s), here are some container images that will satisfy all the troubleshooting needs.
🐧 Nixery
"Hey, I need an image with terraform, kubectl, helm, curl, and ffmpeg!"
"Sure, let's write a Dockerfile, and…"
docker run -ti nixery.dev/shell/terraform/kubectl/kubernetes-helm/curl/ffmpegDONE 🎉 The image gets generated on the fly. This is probably the most magical thing you'll see today.
🧰 Infuser
Another option is to use an image such as Infuser. Infuser is built around tea CLI which automatically installs any tool that you invoke. Let's say you run curl in a container, but it's not installed. No problem, tea will first install it and then invoke your command:
docker run --rm -it ghcr.io/teaxyz/infuser# curl is not installed...
tea $ curl https://google.com
# installed: ~/.tea/curl.se/ca-certs/v2023.5.30
# installed: ~/.tea/curl.se/v8.2.1
# installed: ~/.tea/openssl.org/v1.1.1u
<HTML><HEAD><meta http-equiv="content-type" content="text/html;charset=utf-8">
<TITLE>301 Moved</TITLE></HEAD><BODY>
<H1>301 Moved</H1>
The document has moved
<A HREF="https://www.google.com/">here</A>.
</BODY></HTML>
# ... but worked anyway!
tea $🛠️ Netshoot
As for more specialized tools, if I need to troubleshoot anything network-related, I always reach for netshoot. It contains all the networking tools you might need, all you need to do is run:
docker run --rm -it nicolaka/netshoot
# OR
kubectl run tmp-shell --rm -i --tty --image nicolaka/netshoot
The above images should satisfy your troubleshooting needs, but there are a couple of honorable mentions:
- alpine-containertools - Image with common container tooling. Targeted at security assessment tools.
- Koolkits - Language-specific container images that contain a (highly-opinionated) set of tools for debugging applications running in Kubernetes pods. Intended for use with
kubectl debug. - doks-debug - Digital Ocean Kubernetes Service debug image, intended for debugging Kubernetes clusters. Contains lots of useful tools for debugging clusters not only in Digital Ocean.
- Utils - Image with a different set of tools, this one includes various database clients and MQ tools.
🤖 Use AI to Debug Kubernetes
AI-powered tools can help you with Kubernetes work by automating tasks, improving reliability, and providing insights.
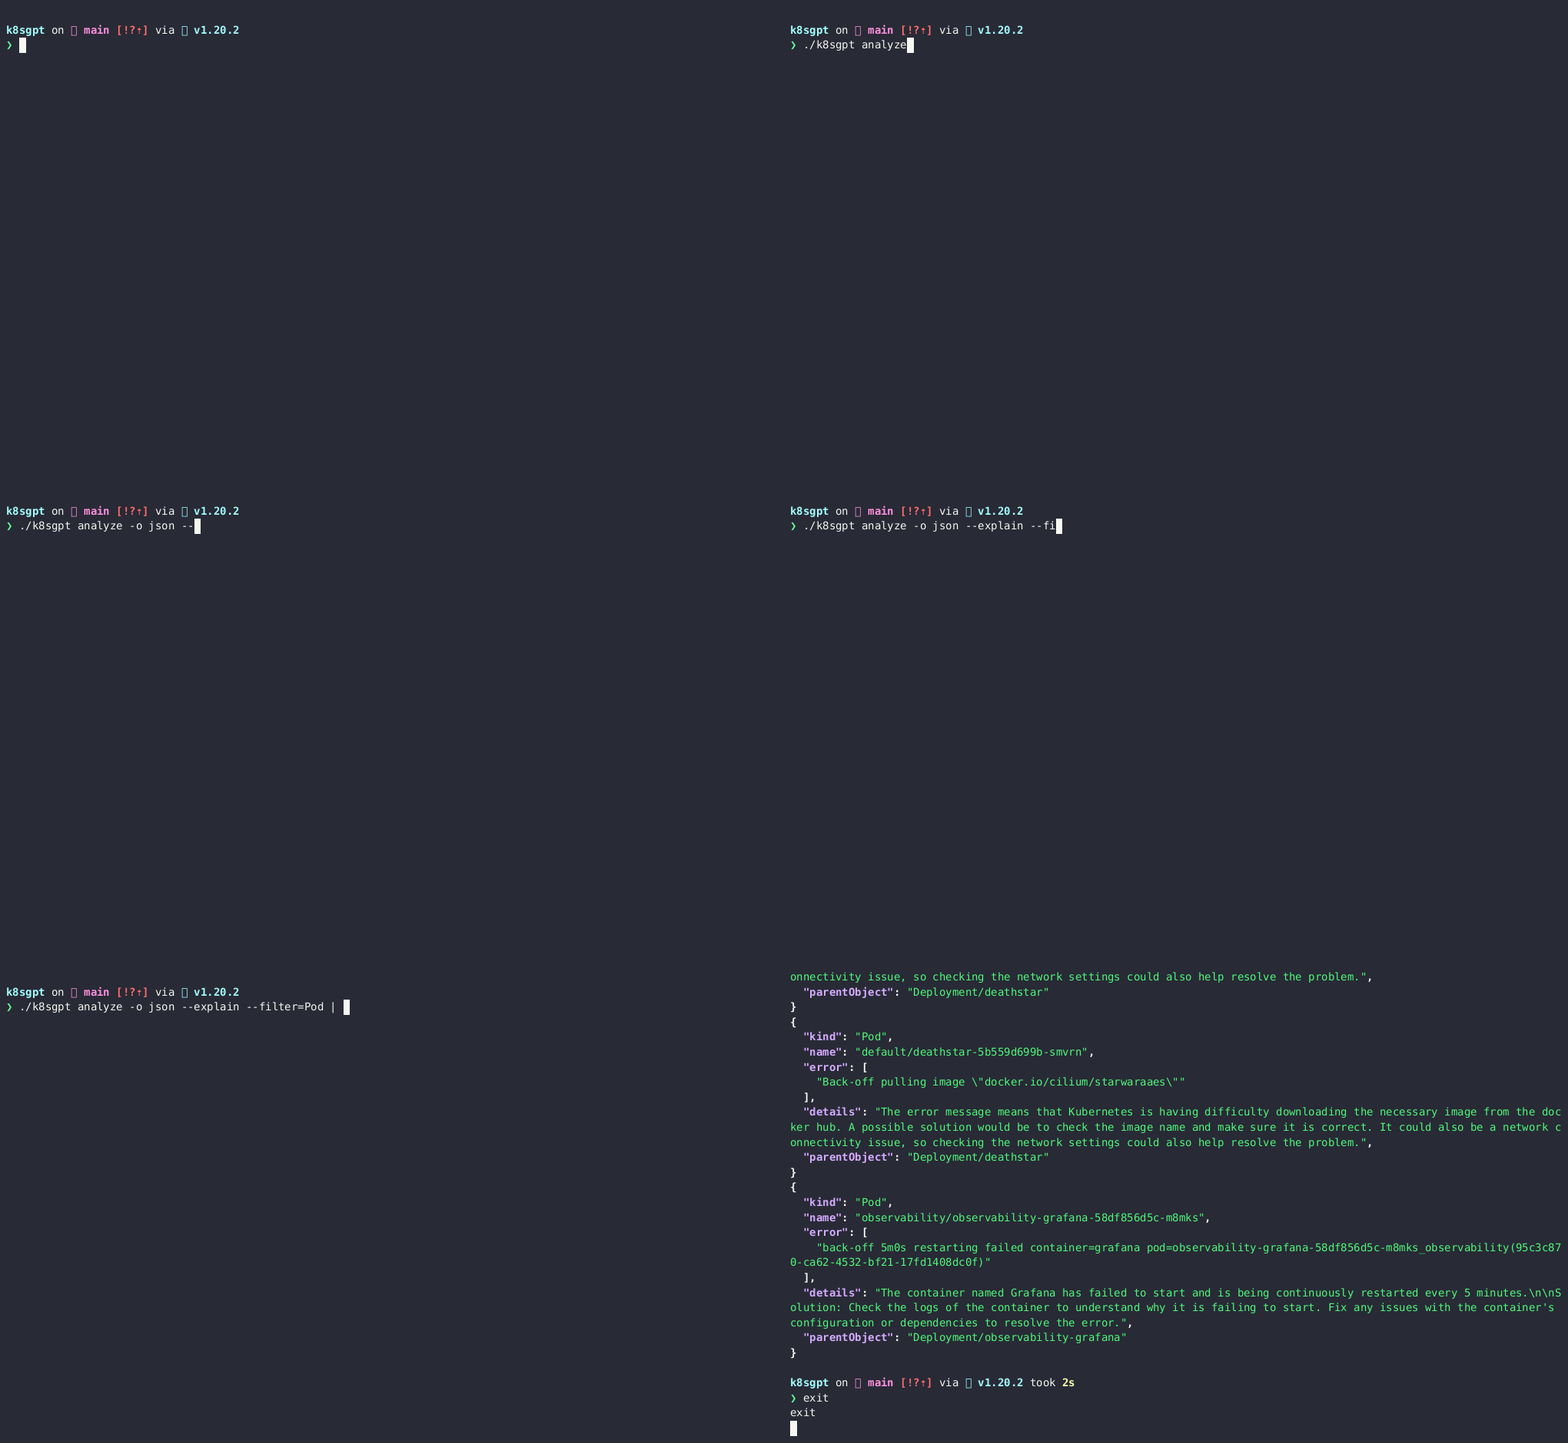
✨ K8sGPT
K8sGPT is an open-source project that uses AI models to explain Kubernetes error messages and provide cluster insights. It is already used by two organizations in production.
K8sGPT Features:
- Provides detailed and contextualized explanations of Kubernetes error messages
- Provides cluster insights
- Supports multiple installation options
- Supports different AI backends
K8sGPT is the most well-known and widely used project of its kind. Launched by Alex Jones, it is marketed as a way to "give Kubernetes superpowers to everyone."

✨ kubectl-ai
This project is a kubectl plugin to generate and apply Kubernetes manifests using OpenAI GPT.
To make it more interesting and understand in a visualized way, we will leverage Kubectl + OpenAI plugin.
Usage:
Prerequisites:
kubectl-ai requires a valid Kubernetes configuration and one of the following:
- OpenAI API key
- Azure OpenAI Service API key and endpoint
- Local AI (see getting started)

🛠️ Cluster-Level Debugging
Here is an overview of how to troubleshoot and debug a Kubernetes cluster.
Get Cluster Information
The first step when debugging a Kubernetes cluster is to obtain cluster information. You can do this by running the following command:
kubectl cluster-info

Get Cluster Components' Health Status
The next step is to check the health status of the Kubernetes cluster components, such as the control plane and worker nodes. You can use this command to view the health status of the control plane components:
kubectl get componentstatus

This command will display the health status of the control plane components, including the etcd, kube-apiserver, kube-controller-manager, and kube-scheduler (depending on the components installed for your cluster).
To check the health status of the worker nodes, you can use the following command:
kubectl get nodes

View the Events in the Cluster
The final step is to view the events in the cluster. Events can be used to track changes and actions that occur in the cluster, including the creation, modification, and deletion of resources. To view the events in the cluster, you can use the following command:
kubectl get events

This command will display a list of events that have occurred in the cluster, including their type, reason, message, and timestamp. You can use this information to troubleshoot issues in the cluster, such as resource allocation problems or unexpected resource deletions.
You can also filter events based on specific criteria by using this command:
kubectl get events --field-selector involvedObject.kind=Pod

This command will display events that are related to pods. You can replace Pod with other resource types, such as Service or Deployment, to filter events based on specific resource types.
🔚 Conclusion
Now that you've got these helpful tricks and tools, fixing issues in Kubernetes (K8s) is much easier. No more frustration — you'll feel like an expert! Keep things simple, smooth out any problems, and enjoy your stress-free journey with K8s.
Until next time, つづく 🎉
💡 Thank you for Reading !! 🙌🏻😁📃, see you in the next blog.🤘 Until next time 🎉
🚀 Thank you for sticking up till the end. If you have any questions/feedback regarding this blog feel free to connect with me:
♻️ LinkedIn: https://www.linkedin.com/in/rajhi-saif/
♻️ X/Twitter: https://x.com/rajhisaifeddine
The end ✌🏻
🔰 Keep Learning !! Keep Sharing !! 🔰
📅 Stay updated
Subscribe to our newsletter for more insights on AWS cloud computing and containers.
