AWS EKS Monitoring Stack: Grafana, Prometheus, AlertManager, Promtail, and Loki
Content
Monitoring AWS EKS with performant open source tools
🔖 Introduction
Amazon Elastic Kubernetes Service (EKS) is a managed Kubernetes service that makes it easy to run Kubernetes on AWS. However, EKS doesn't come with a built-in monitoring solution. This means that you need to set up your own monitoring stack if you want to track the health and performance of your EKS cluster.
In this article, we will show you how to create a monitoring stack for AWS EKS using Grafana, Prometheus, AlertManager, Promtail, and Loki. These open source tools provide a comprehensive monitoring solution that can help you track all aspects of your EKS cluster, from metrics to logs.
We will walk you through the steps of installing and configuring these tools, and we will show you how to create dashboards in Grafana to visualize your data. By the end of this article, you will have a solid understanding of how to monitor your AWS EKS cluster using open source tools.

🎯 Goals & Objectives
If you are looking for a comprehensive and cost-effective monitoring solution for your AWS EKS cluster, then this monitoring stack is a great option. So, roll your sleeves and let's get cracking! 🔥
📋 Prerequisites
- Knowledge of Kubernetes.
- AWS EKS cluster.
- Helm.
🛠️ Kube-Prometheus-Stack: An Effective Way to Monitor AWS EKS Cluster
Kube-Prometheus-stack, also known as Prometheus Operator, is a popular open-source project providing complete monitoring and alerting solutions for Kubernetes clusters. It combines tools and components to create a monitoring stack for Kubernetes environments.
We will use the official Helm Chart Kube-Prometheus-stack, with a customized value file.
Steps to Deploy the Monitoring Stack
-
Creating Namespace called monitoring
kubectl create namespace monitoring -
Add a new Helm Repository
helm repo add prometheus-community https://prometheus-community.github.io/helm-charts helm repo update -
Edit the Values
These settings indicate that the selectors mentioned (rule, service monitor, pod monitor, and scrape config) will have independent configurations and will not be based on Helm graphic values.
prometheus: enabled: true agentMode: false annotations: {} networkPolicy: enabled: false flavor: kubernetes serviceAccount: create: true name: "" annotations: {} serviceMonitor: interval: "" selfMonitor: true sampleLimit: 0 targetLimit: 0 labelLimit: 0 labelNameLengthLimit: 0 labelValueLengthLimit: 0 scheme: "" tlsConfig: {} bearerTokenFile: metricRelabelings: [] relabelings: [] prometheusSpec: disableCompaction: false enableRemoteWriteReceiver: false replicaExternalLabelName: "" replicaExternalLabelNameClear: false prometheusExternalLabelName: "" prometheusExternalLabelNameClear: false externalUrl: "" nodeSelector: {} secrets: [] configMaps: [] query: {} ruleNamespaceSelector: {} ruleSelectorNilUsesHelmValues: true ruleSelector: {} serviceMonitorSelectorNilUsesHelmValues: true serviceMonitorSelector: {} serviceMonitorNamespaceSelector: {} podMonitorSelectorNilUsesHelmValues: true podMonitorSelector: {} podMonitorNamespaceSelector: {} probeSelectorNilUsesHelmValues: true probeSelector: {} probeNamespaceSelector: {} scrapeConfigSelectorNilUsesHelmValues: true scrapeConfigSelector: {} scrapeConfigNamespaceSelector: {} retention: 10d retentionSize: "" tsdb: outOfOrderTimeWindow: 0s walCompression: true paused: false replicas: 1 shards: 1 logLevel: info logFormat: logfmt routePrefix: / podMetadata: {} podAntiAffinity: "" podAntiAffinityTopologyKey: kubernetes.io/hostname affinity: {} remoteRead: [] additionalRemoteRead: [] remoteWrite: [] additionalRemoteWrite: [] remoteWriteDashboards: false resources: {} storageSpec: {} volumes: [] volumeMounts: [] additionalScrapeConfigs: [] additionalScrapeConfigsSecret: {} additionalPrometheusSecretsAnnotations: {} additionalAlertManagerConfigs: [] additionalAlertManagerConfigsSecret: {} additionalAlertRelabelConfigs: [] additionalAlertRelabelConfigsSecret: {} arbitraryFSAccessThroughSMs: false overrideHonorLabels: false overrideHonorTimestamps: false ignoreNamespaceSelectors: false enforcedNamespaceLabel: "" prometheusRulesExcludedFromEnforce: [] excludedFromEnforcement: [] queryLogFile: false enforcedSampleLimit: false enforcedTargetLimit: false enforcedLabelLimit: false enforcedLabelNameLengthLimit: false enforcedLabelValueLengthLimit: false allowOverlappingBlocks: false minReadySeconds: 0 hostNetwork: false hostAliases: [] tracingConfig: {} -
Run the Helm Deployment Command
helm upgrade --install -f values.yaml kube-prometheus-stack prometheus-community/kube-prometheus-stack -n monitoring
After we deploy the Kube-Prometheus stack, we get:
- Grafana
- Prometheus
- AlertManager
🧪 Testing
To check if everything is working, you can use the following commands:
Prometheus Dashboard
kubectl port-forward svc/prometheus-operated 9090:9090 -n monitoringYou can access the Prometheus dashboard at http://localhost:9090.
Grafana Dashboard
kubectl port-forward svc/kube-prometheus-stack-grafana 3000:3000 -n monitoringYou can access the Grafana dashboard at http://localhost:3000.
Check Running Pods
To ensure all pods are running, use the following command:
kubectl get pods --namespace monitoring🛡️ Create a ServiceMonitor
Prometheus Operator uses ServiceMonitors to auto-detect target pods based on label selectors and associate them with Prometheus instances. The ServiceMonitor defines an application that scrapes metrics from Kubernetes.
Below is an example manifest for a ServiceMonitor:
apiVersion: monitoring.coreos.com/v1
kind: ServiceMonitor
metadata:
    name: prometheus-self
    labels:
        app: kube-prometheus-stack-prometheus
spec:
    endpoints:
        - interval: 30s
            port: web
    selector:
        matchLabels:
            app: kube-prometheus-stack-prometheus
The ServiceMonitor defined above will select pods labeled app: kube-prometheus-stack-prometheus using the spec.selector.matchLabels field.
To apply the ServiceMonitor manifest, run the following command:
kubectl apply -f servicemonitor.yaml -n monitoring🔗 Integration of Promtail and Loki to Grafana
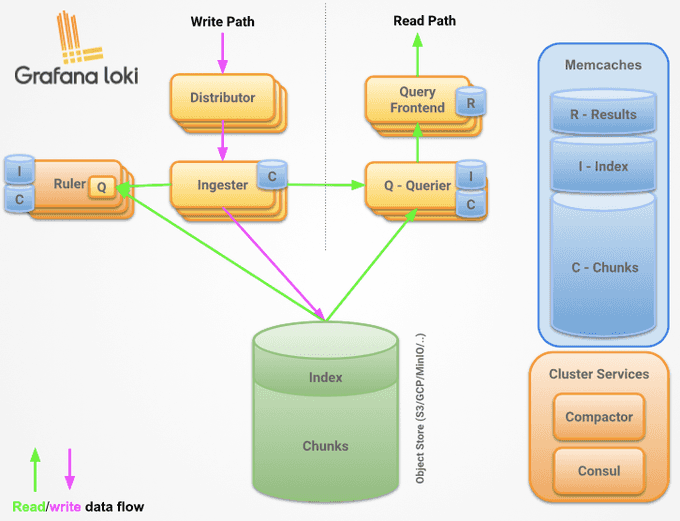
Promtail is a log agent that ships logs to Loki, a horizontally scalable, highly available, and efficient log store. Loki can be integrated with Grafana to create dashboards that visualize your logs and metrics. This integration provides a powerful way to monitor your applications and infrastructure.
📜 Intro to Loki
Loki uses Promtail as its primary log collector, but it can also accept log flows from other sources, such as Syslog or other log senders. It offers high uptime and supports data replication across multiple replicas for durability and fault tolerance. Loki is tightly integrated with Grafana, allowing you to visualize log metrics. Think of Loki as Prometheus, but for logs.

📥 Add a New Helm Repository
helm repo add grafana https://grafana.github.io/helm-charts
helm repo update
🚀 Run the Helm Deployment Command
helm upgrade --install loki grafana/loki-distributed -n monitoringAfter deploying Loki, update the Kube-Prometheus-stack values file to add additional data sources. This configuration defines a default additional data source that connects to a Loki log aggregation system. It specifies the URL for accessing Loki and sets the access method to the proxy.
grafana:
    additionalDataSources:
        - name: Loki
            type: loki
            url: http://loki-loki-distributed-gateway.monitoring.svc.cluster.local
            access: proxy
Please refer to the Helm values for more details.
📜 Intro to Promtail
Promtail can log files from different sources, including local files, container output streams (stdout and stderr), and systemd journals. It supports the development, filtering, and relabeling of logs before sending them to Loki.
clients:
    - url: http://loki-loki-distributed-gateway.monitoring.svc.cluster.local/loki/api/v1/push
Please refer to the Helm values for more details.
🚀 Run the Helm Upgrade Command
helm upgrade --install -f promtail.yaml promtail grafana/promtail -n monitoringAfter deploying Promtail and Loki, two new data sources will be presented to Grafana.
🔍 Access Grafana
Run the following command to port-forward Grafana:
kubectl port-forward svc/kube-prometheus-stack-grafana 3000:3000 -n monitoringConnect to Grafana by navigating to http://localhost:3000, then go to Menu -> Data Sources to add the new data sources.
📝 Summary
Setting up a monitoring stack for Kubernetes is a complex task, but it is essential for ensuring the health and performance of your applications. The steps outlined in this article provide a good starting point, but they are just the beginning. In most cases, workloads will not be limited to Kubernetes pods and containers. There will also be a need to monitor virtual machines and other infrastructure components. A unified logging mechanism based on the same tools is essential for getting a complete view of your system.
Until next time, つづく 🎉
💡 Thank you for Reading !! 🙌🏻😁📃, see you in the next blog.🤘 Until next time 🎉
🚀 Thank you for sticking up till the end. If you have any questions/feedback regarding this blog feel free to connect with me:
♻️ LinkedIn: https://www.linkedin.com/in/rajhi-saif/
♻️ X/Twitter: https://x.com/rajhisaifeddine
The end ✌🏻
🔰 Keep Learning !! Keep Sharing !! 🔰
📅 Stay updated
Subscribe to our newsletter for more insights on AWS cloud computing and containers.
